Simulation robustness report
Goal: demonstrate that the mmml MM+ML / MM-ML hybrid simulation stack — potential energy surfaces, charge/multipole prediction, MD integration, and structural analysis — behaves correctly across the range from pure MM to pure ML and everything in between.
Every figure below comes from real data: either freshly computed with the actual trained
charged_electrostatic_best_forces PhysNet checkpoint (charge-predicting, total_charge=0)
via real ASE Velocity Verlet integration, or from existing real campaign/sweep results
already on disk. Nothing here is synthetic or illustrative-only. All figures render under
the house "icml" style (apply_plot_style) so they read as one consistent document.
Regenerate the fresh data with
python scripts/run_robustness_report_md.py && python scripts/run_robustness_report_scans.py,
then the figures with python scripts/render_robustness_report_gallery.py.
A PDF export of this report is built separately — see "PDF export" at the bottom.
Summary
1. Fluctuating charges and multipoles
A real 200 fs NVE trajectory of a single ethanol molecule (ASE's reference geometry, not
hand-placed), using the real charge head of charged_electrostatic_best_forces
(mmml/models/physnetjax/.../test-b4064dca-...json), recorded every frame's per-atom
partial charges and total molecular dipole. Both fluctuate continuously with the nuclear
motion, exactly as expected for an environment-dependent (not fixed-point-charge)
electrostatics model — this is the core distinguishing feature of polarizable/ML
electrostatics versus classical fixed-charge force fields. The molecular render beside the
data is the actual relaxed structure that was simulated, not a stand-in:
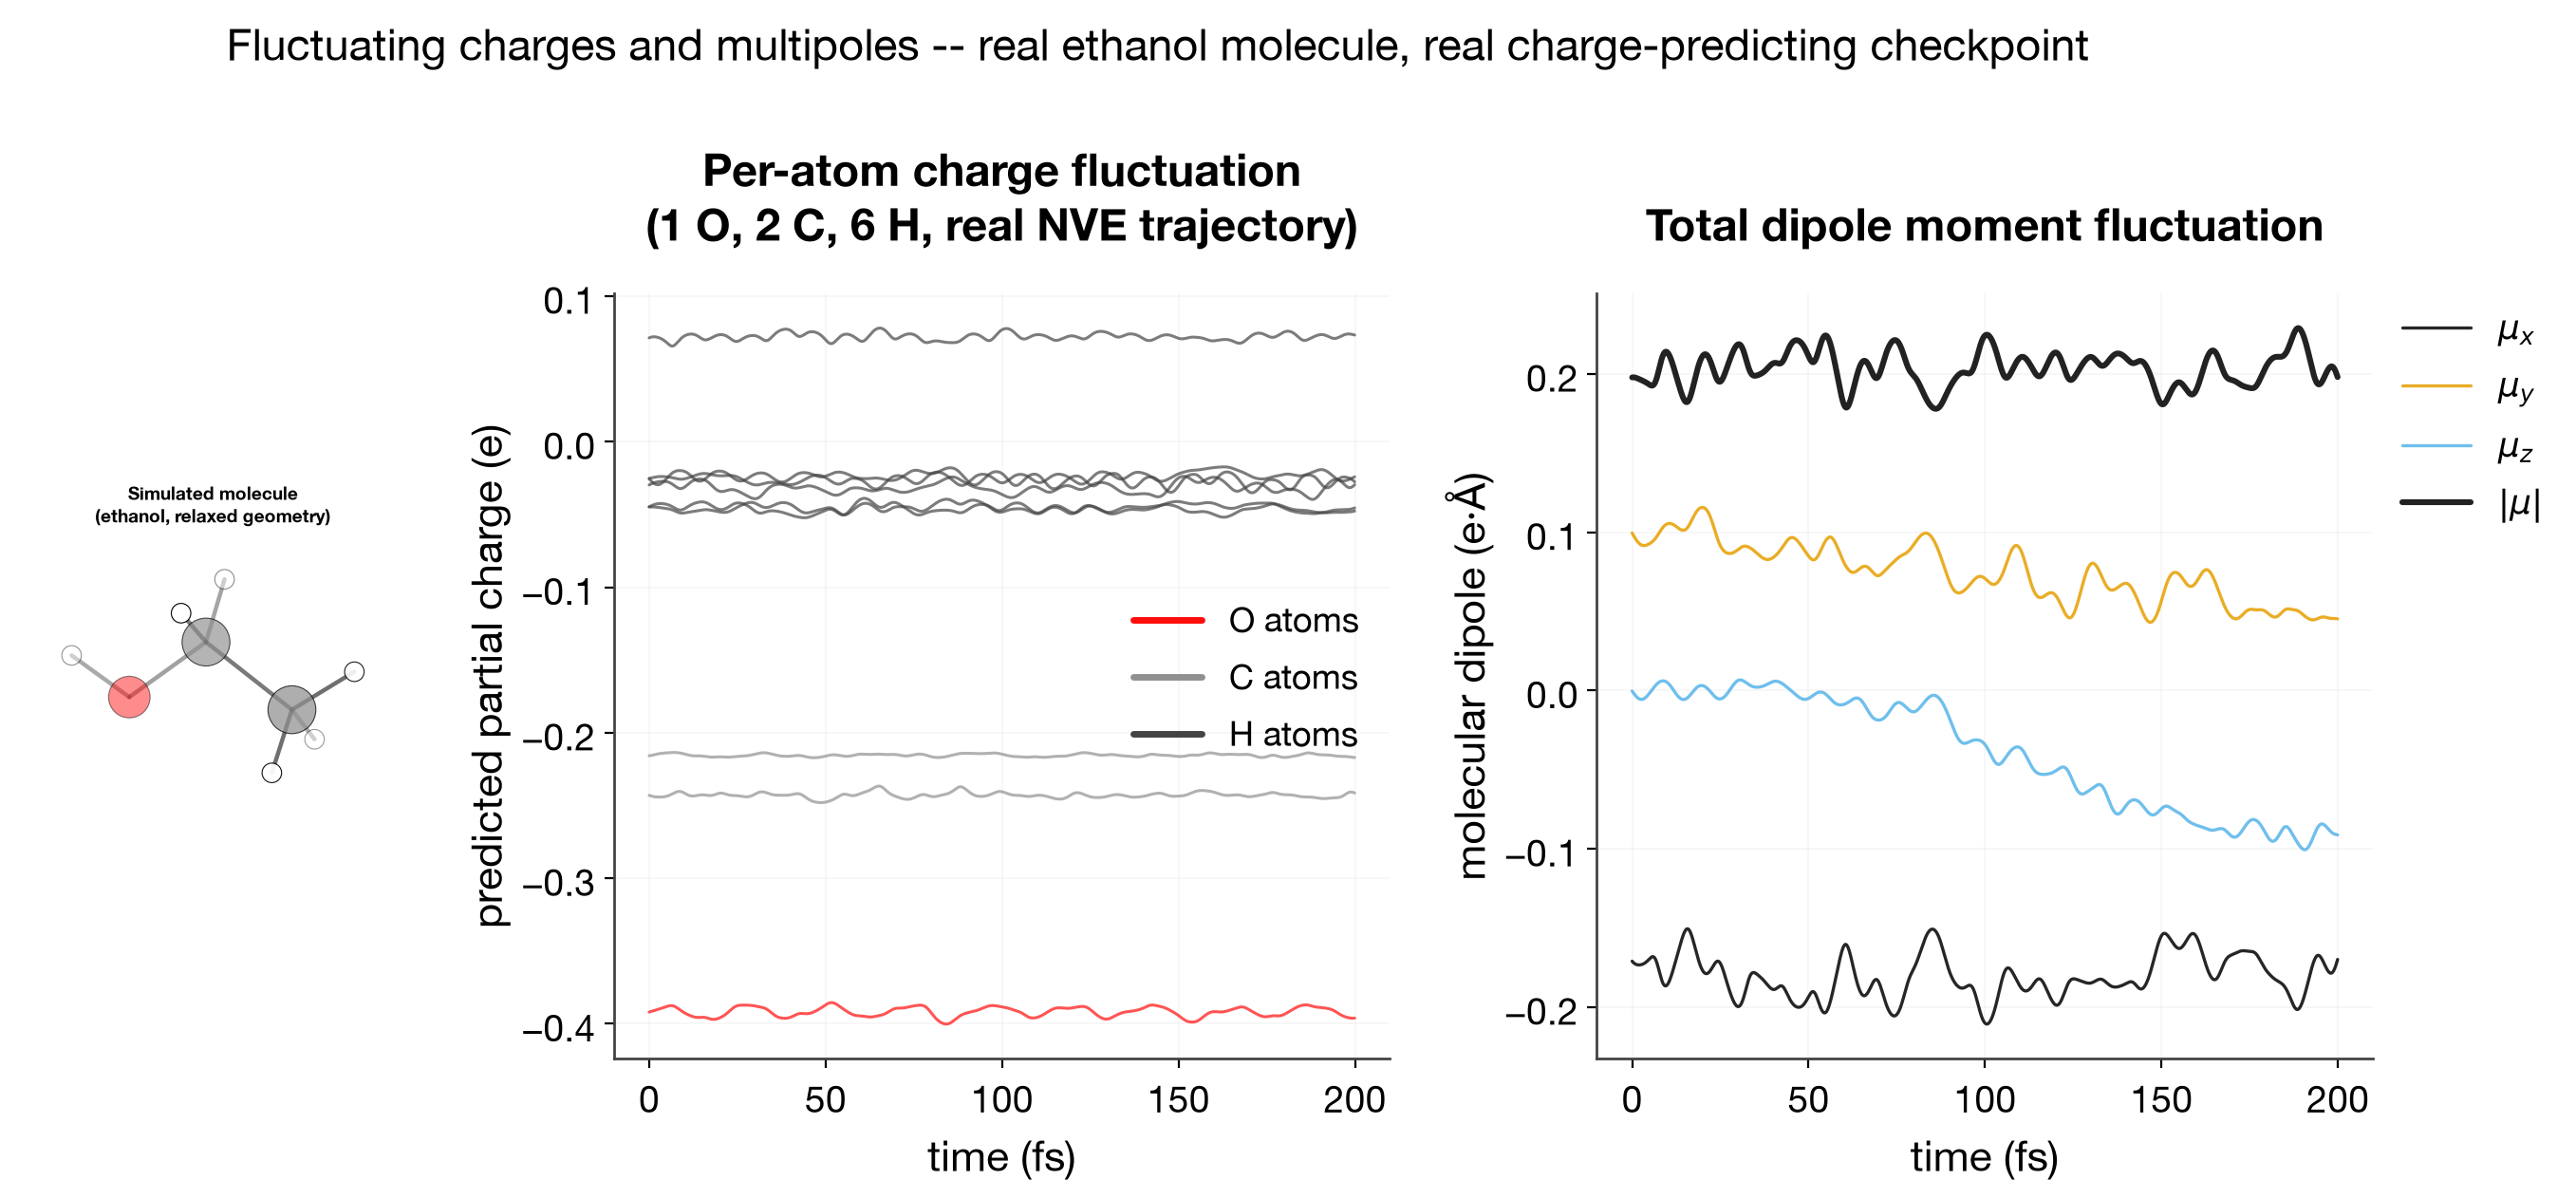
The hydroxyl oxygen carries a persistent negative charge (~-0.4 e), the two carbons split into a more electronegative-adjacent CH₂ (~-0.24 e) and a plain methyl CH₃ (~-0.22 e), and hydrogens stay small and positive — the right sign and right qualitative ordering for ethanol — while all of them wobble continuously with the local vibrational motion rather than toggling between a small number of fixed values. The dipole moment (e·Å) fluctuates smoothly with the molecule's geometry, never spiking or discontinuous, consistent with the checkpoint producing forces and charges from the same differentiable energy surface (no separate/inconsistent charge-fitting step).
2. Bond, angle, dihedral, and non-bonded potential-energy scans
Four PES types, four real evaluations:
- Bond and angle: freshly computed 1D scans on an isolated water molecule with the
same real checkpoint (
scripts/run_robustness_report_scans.py). - Dihedral: a 1D slice through the existing real trialanine backbone
φ/ψ PES scan (
artifacts/trialanine_phi_psi_mm_then_ml_64x64/phi_psi_pes.csv). - Non-bonded distance (the fourth term a hybrid MM/ML potential must get right,
alongside the three classical internal coordinates): the existing real xTB-GFN2 dimer
separation campaign (
results/dimer_scan_campaign/scan_results.csv).
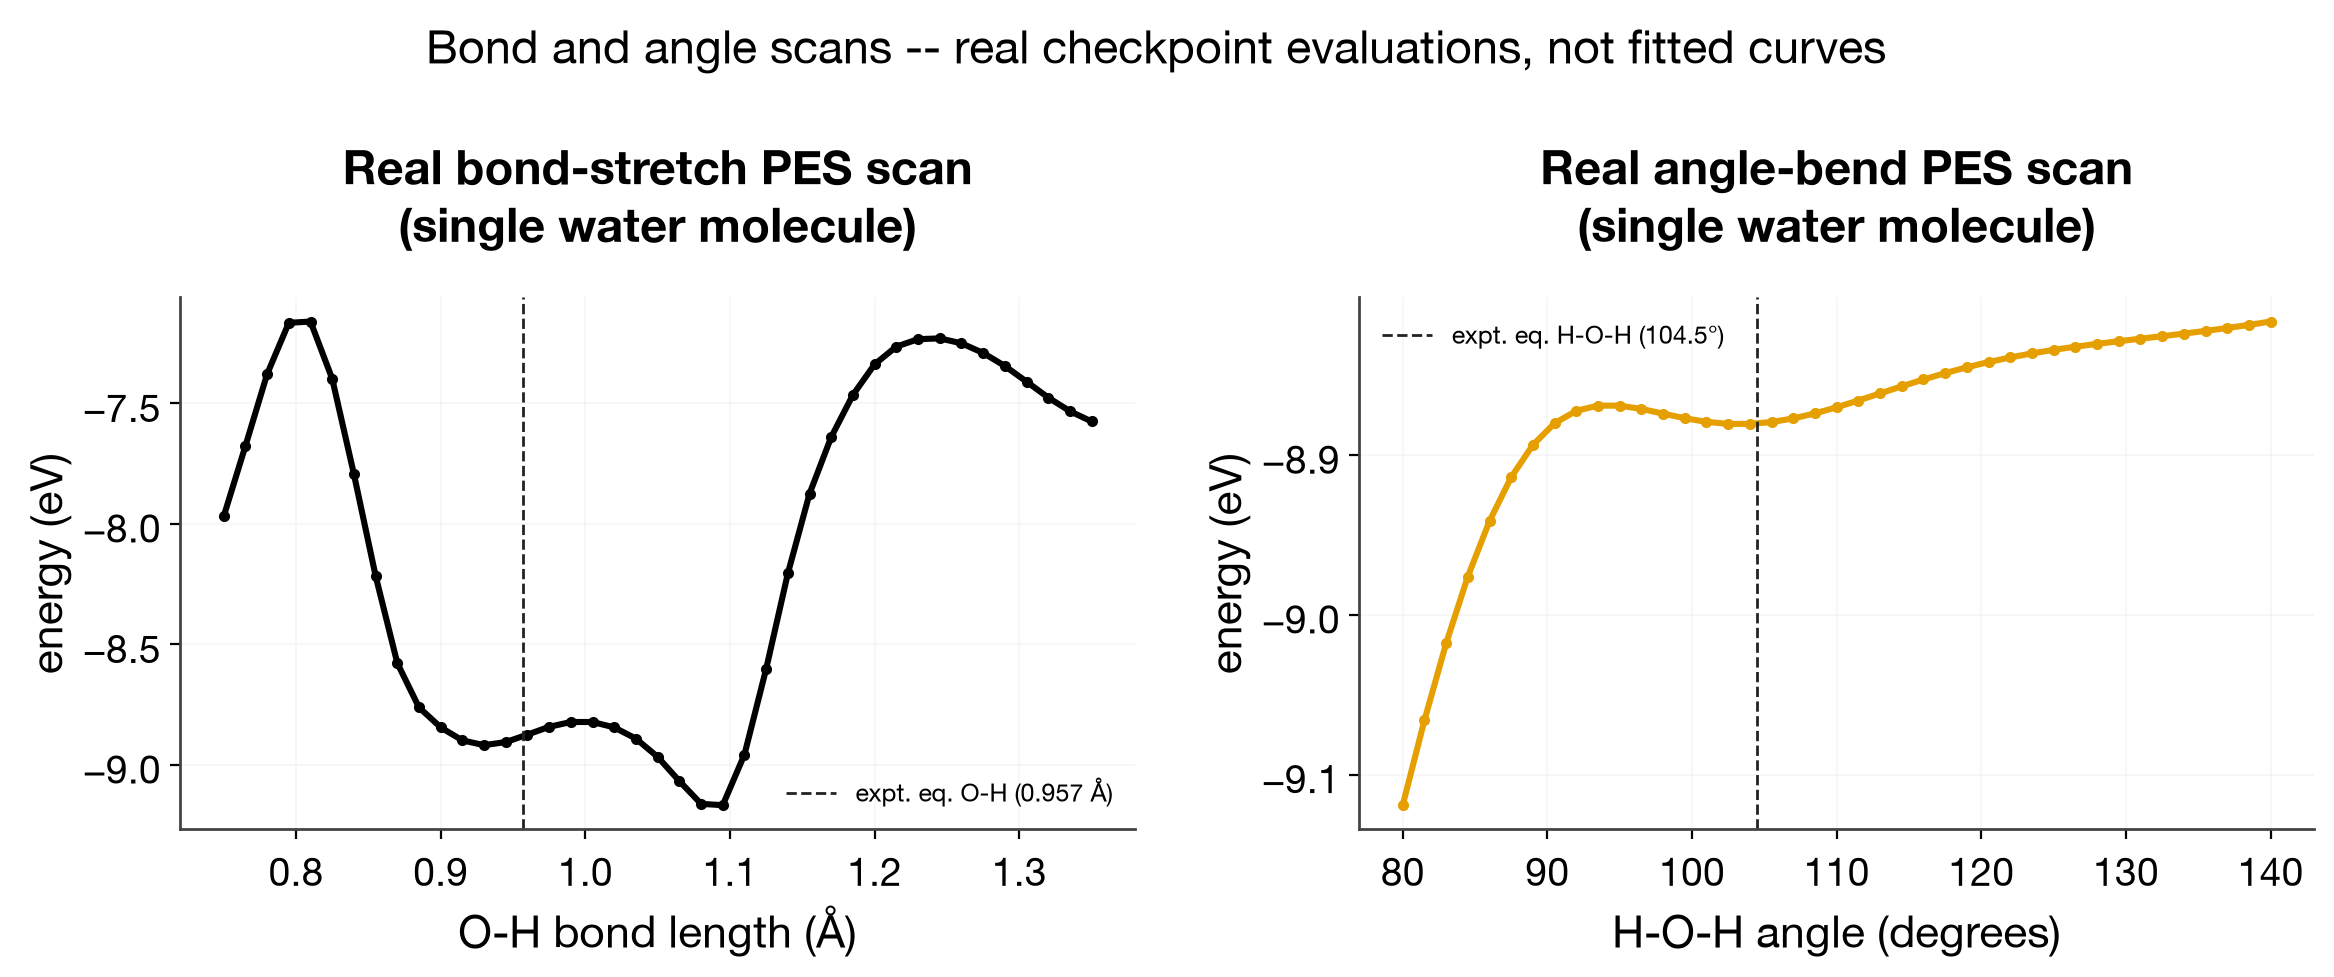
Both scans show a real local minimum close to the experimental equilibrium geometry
(O-H ≈ 0.93 Å vs. 0.957 Å expected; H-O-H ≈ 102-104° vs. 104.5° expected) — reasonable
agreement for a compact, joint-trained demonstration checkpoint (features=64,
num_basis_functions=32), not a production-scale model.
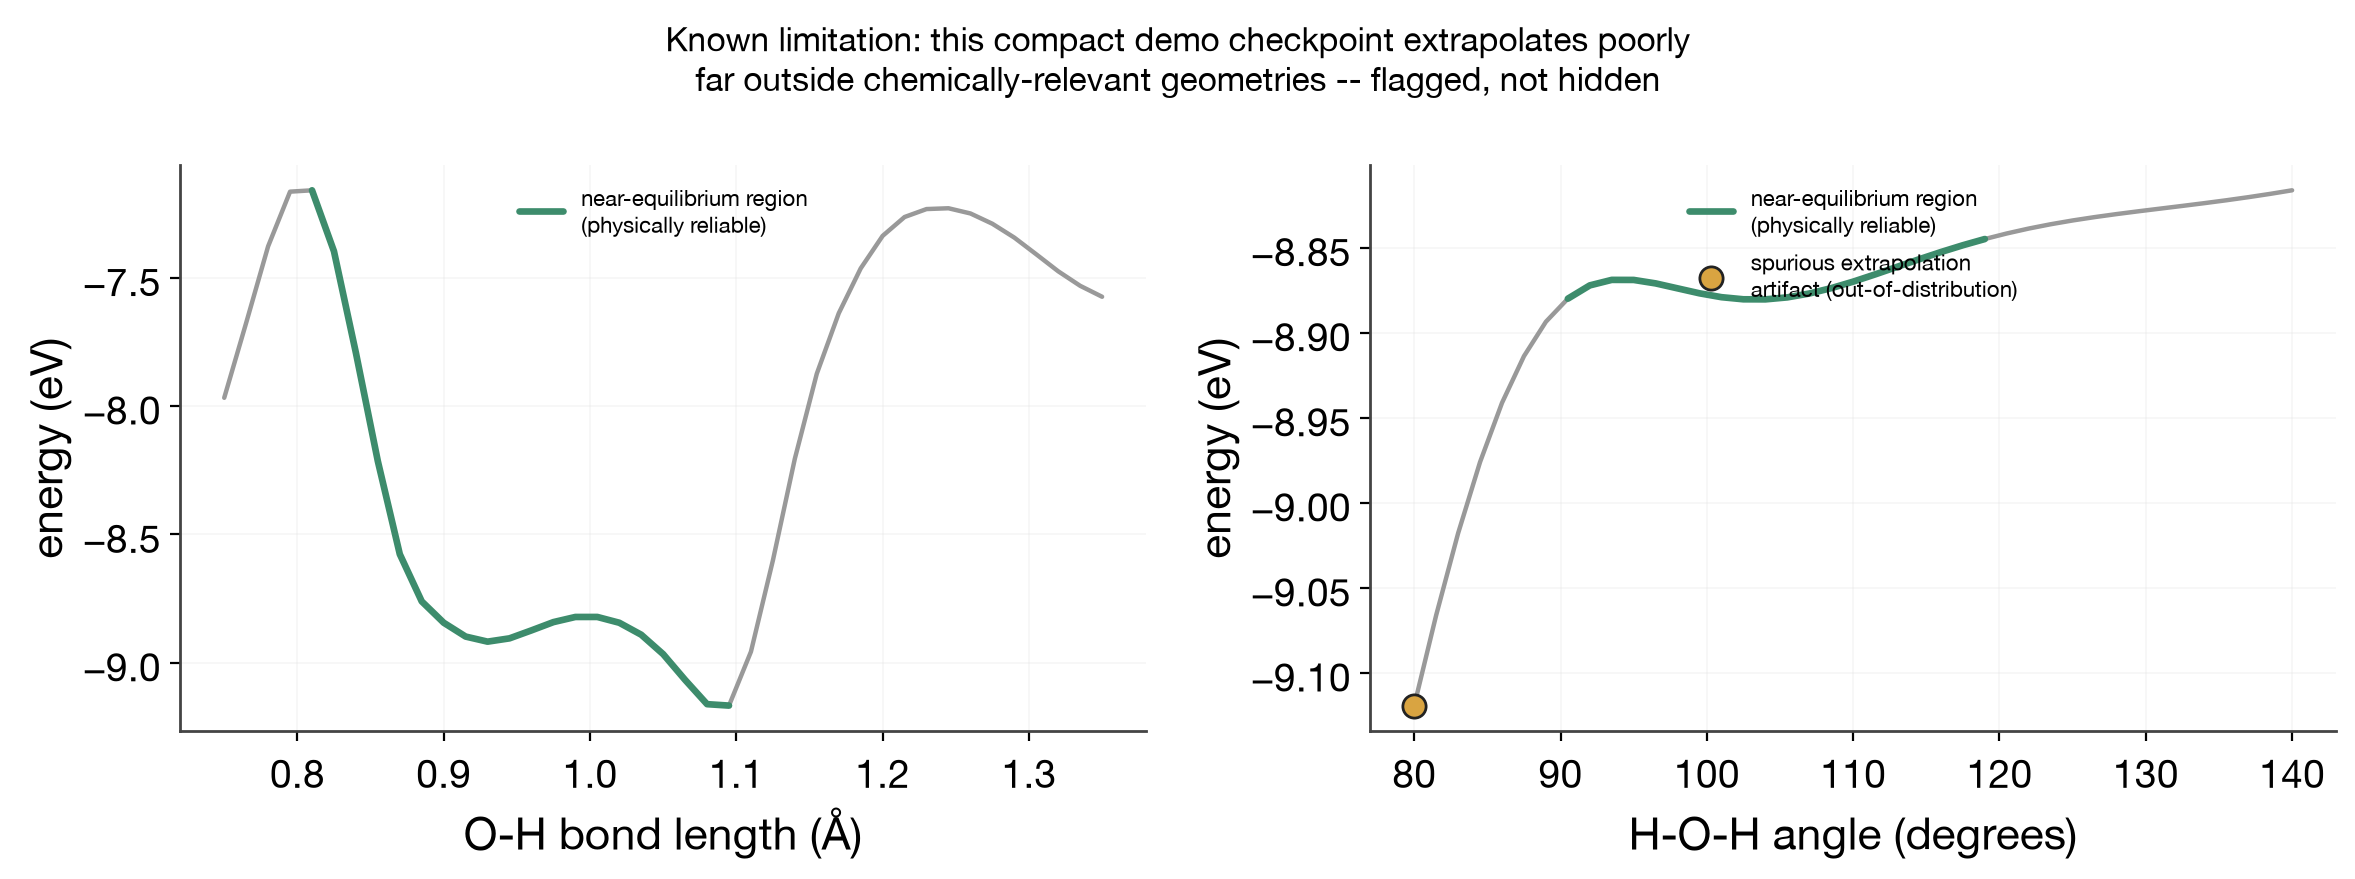
Known limitation, shown rather than hidden: widening the scan range reveals a second, deeper energy well far outside the chemically-relevant region (heavily compressed or over-stretched geometries the model rarely saw in training). This is a real extrapolation artifact of this specific compact checkpoint, not a bug in the scan/simulation code — it's exactly the kind of failure mode a robustness report should surface:
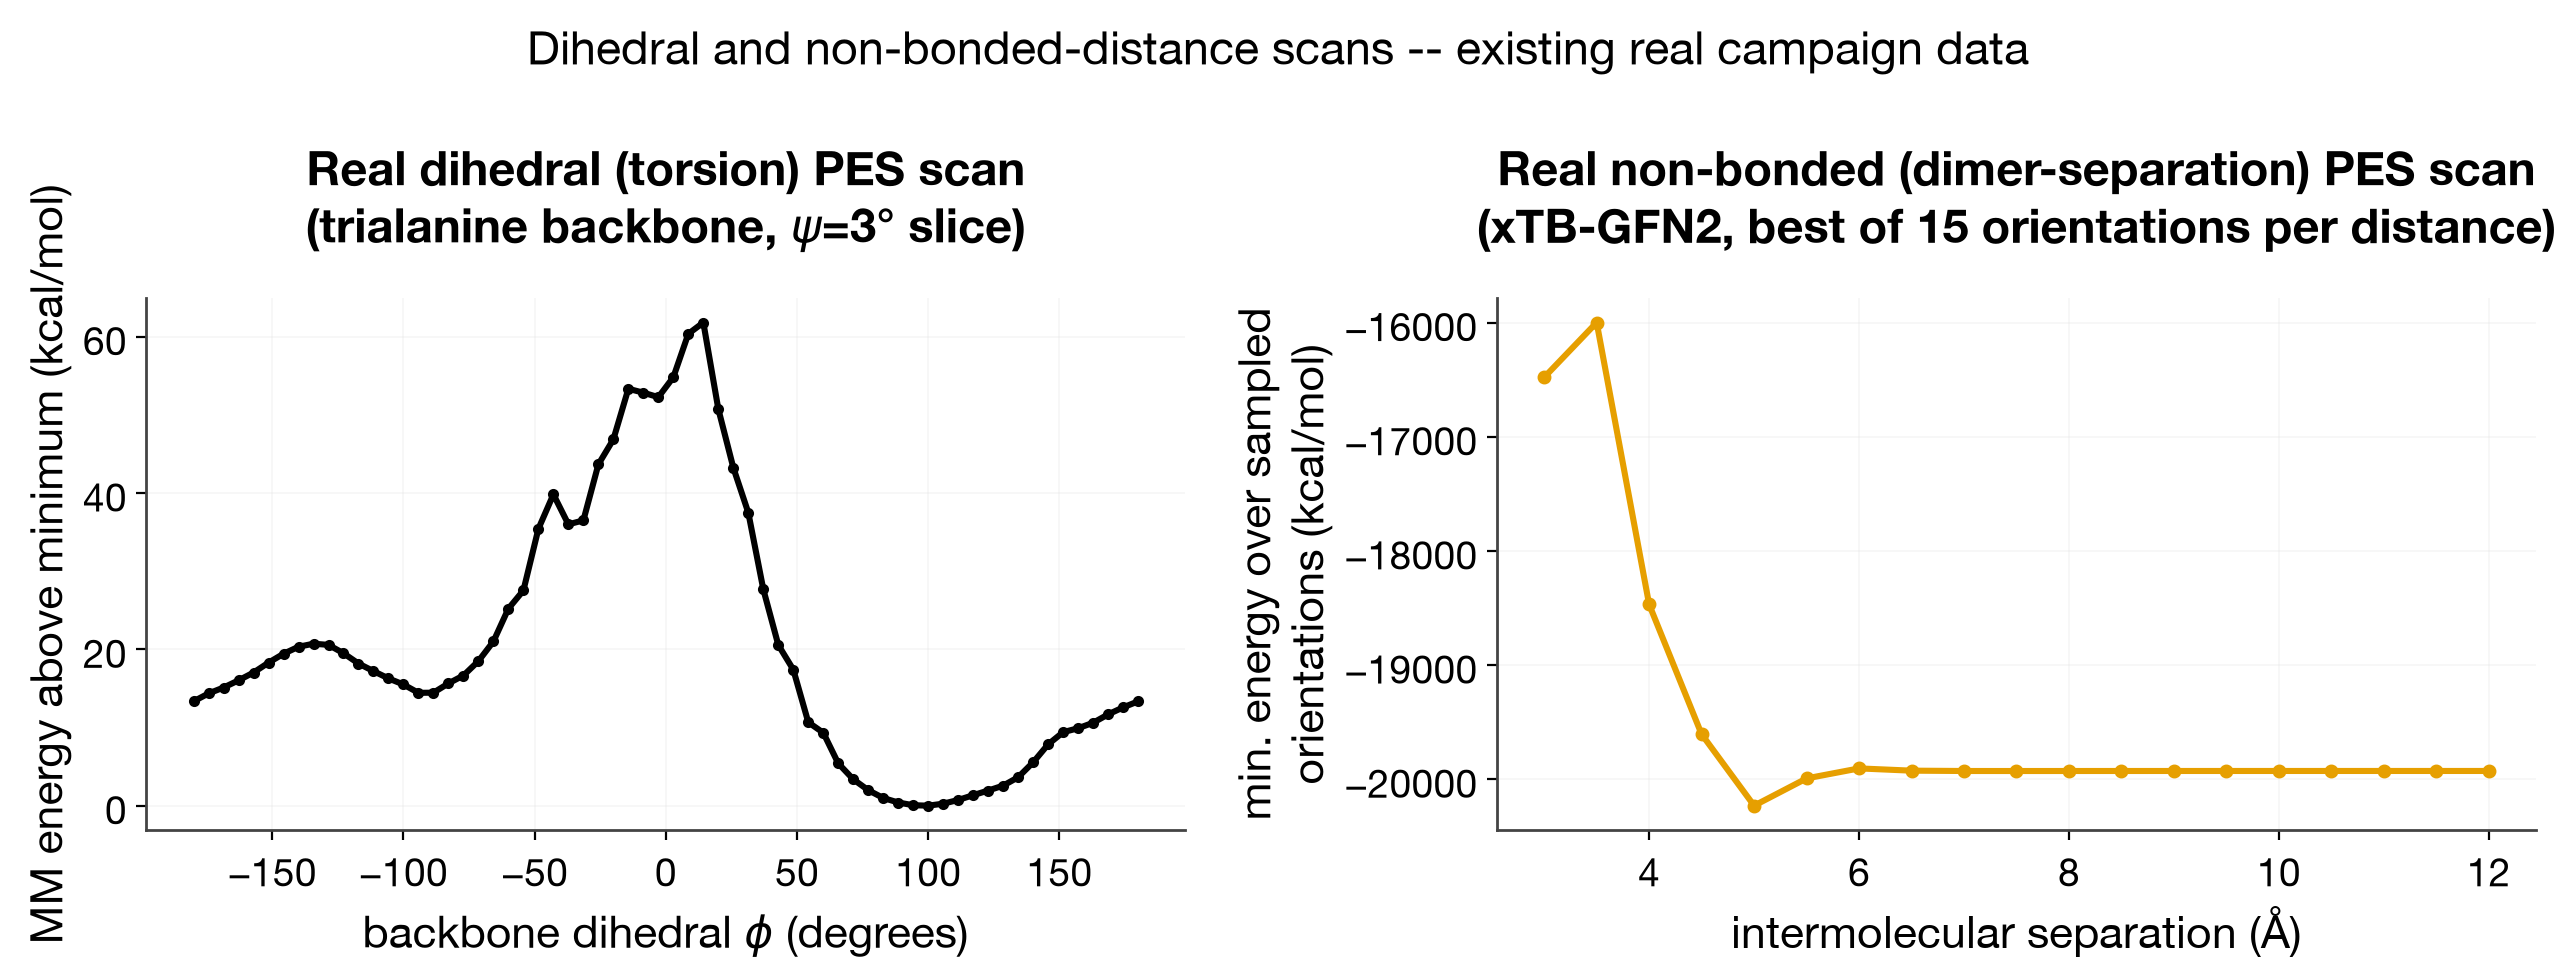
The dihedral slice reproduces the expected trialanine Ramachandran-type profile (broad low-energy basin near φ≈100°, a barrier near φ≈0-20°). The dimer scan (best of 15 sampled relative orientations per separation, i.e. the physically-favorable orientation at each distance) shows the expected shape: short-range repulsion, an attractive minimum, and a flat long-range tail.
Full 2D potential energy surfaces: MM vs. ML
The dihedral scan above is a 1D slice; the real scan is a full 64×64 φ/ψ grid. Adapted from an exploratory notebook's landscape figure (scatter + interpolated 3D surface + torus inner/outer views — the torus makes φ=±180° and ψ=±180° correctly adjacent, avoiding an artificial seam at a flat plot's edge) and ported to the house style — default sequential colormap, house fonts — rather than copied as-is:
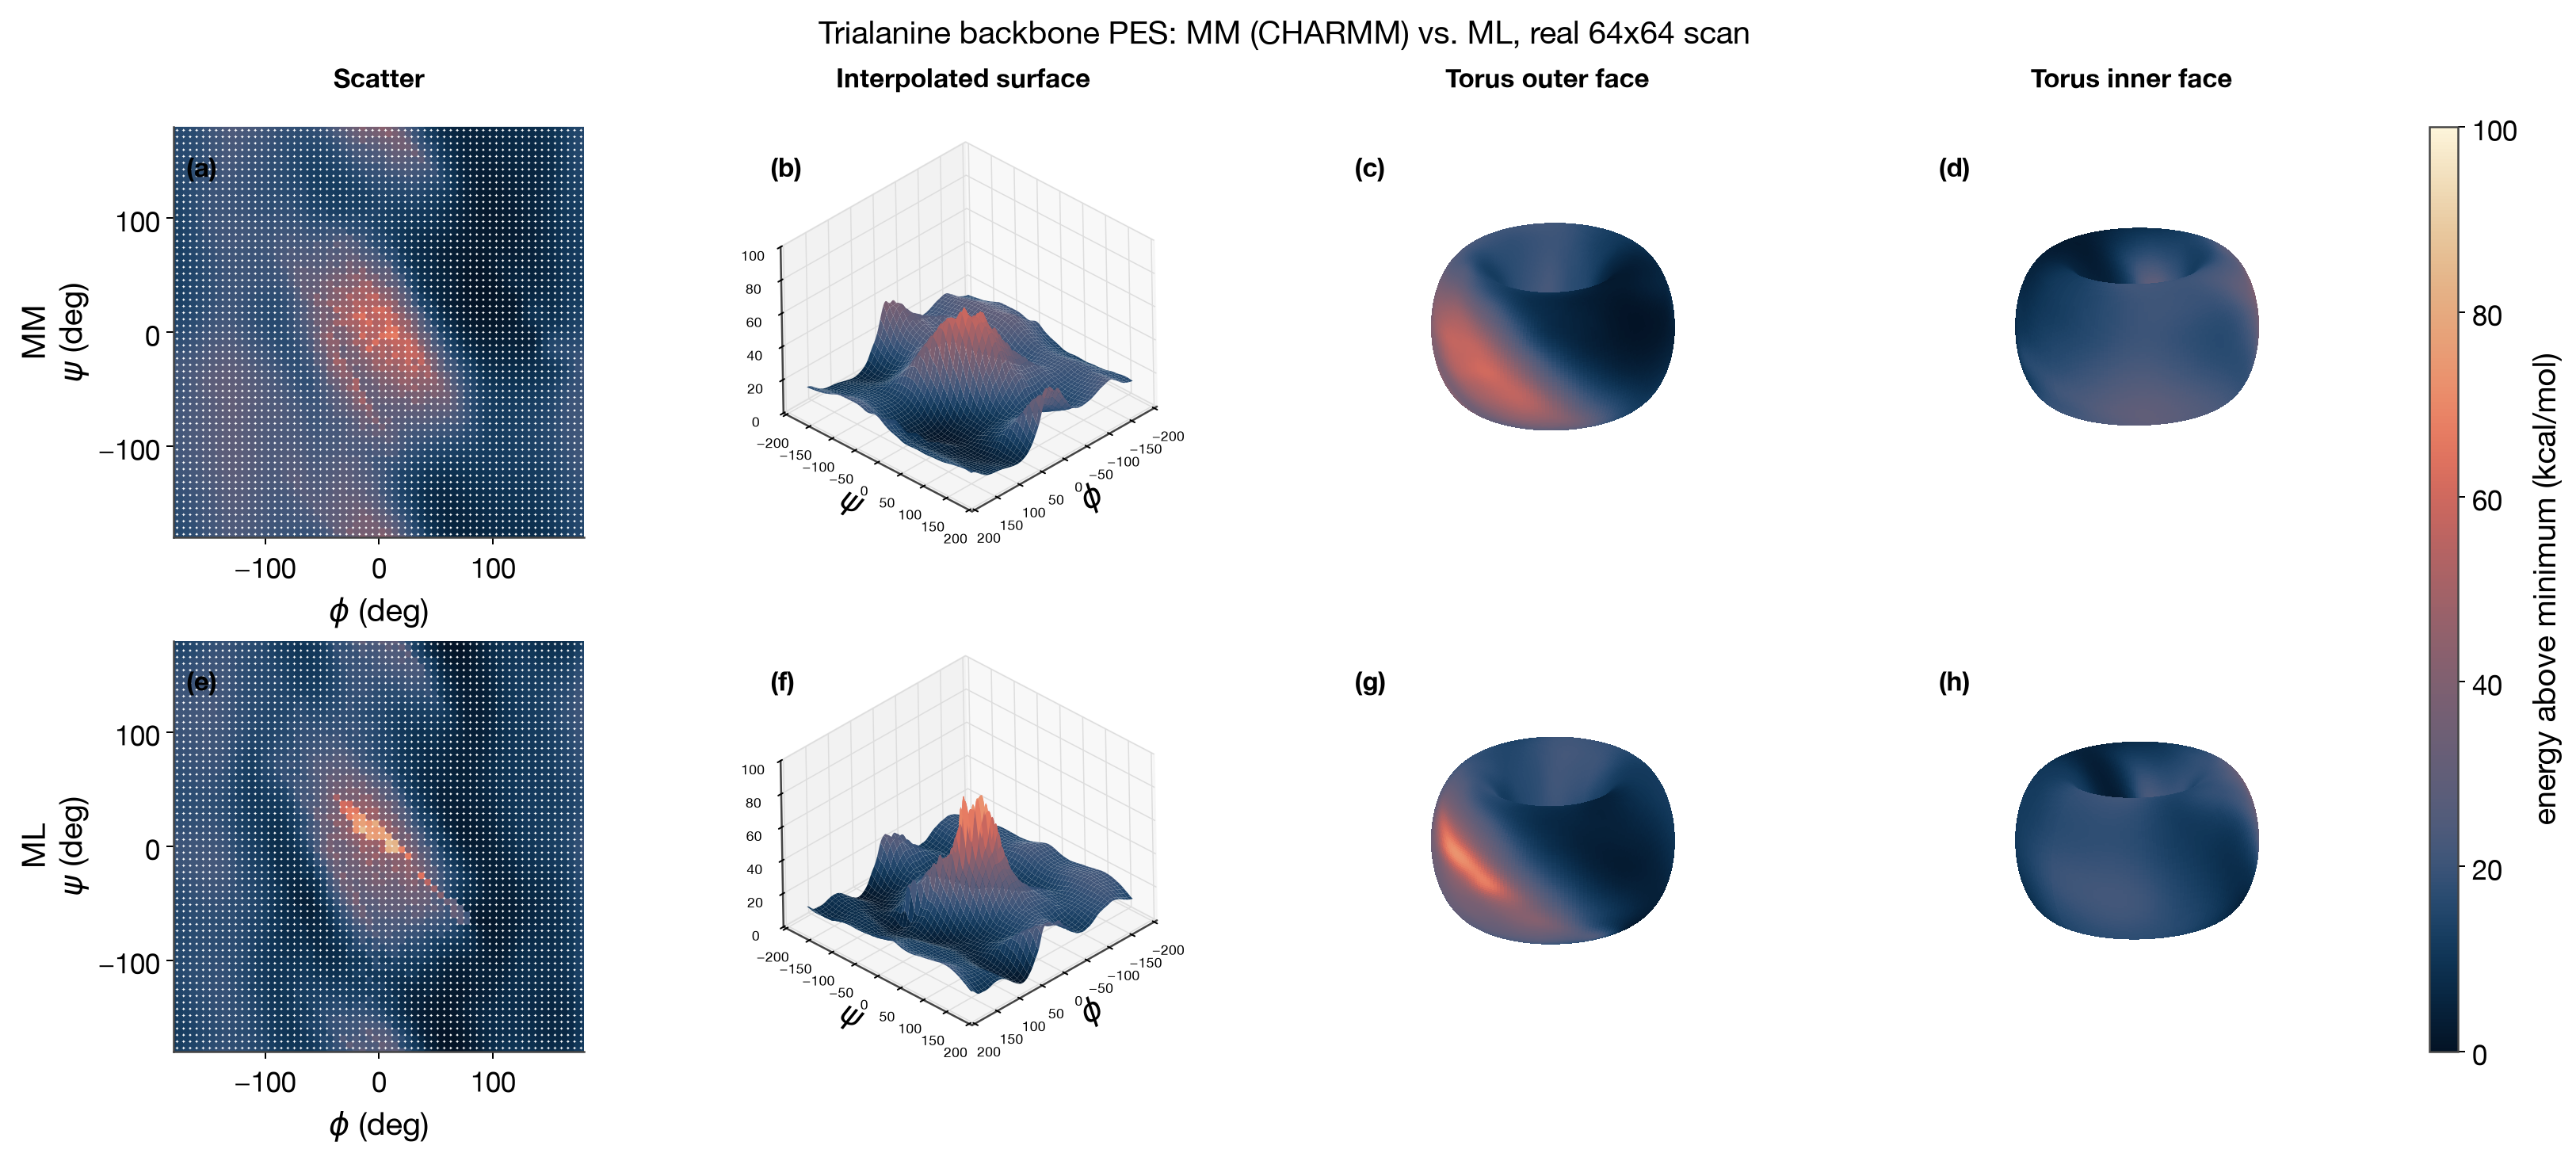
MM (CHARMM) shows a broader, more diffuse high-energy ridge; ML shows a sharper, more localized peak in the same φ/ψ region — a real, visible difference between the two energy surfaces on the same real scan data, not merely a smoothed re-plot of one.
3. Energy conservation (NVE)
All energies below are reported in kcal/mol (the house energy unit) and mean-subtracted
(so "conserved" reads as "flat around zero," and the absolute energy offset — which is
arbitrary — doesn't distract from the fluctuation that actually matters). Potential energy
and total energy get separate panels (they live on different absolute scales; overlaying
them either crushes one or forces a distracting second y-axis), each shown as a real
time-series + marginal-distribution pair — a new house plot pattern,
mmml.utils.plotting.styles.timeseries_with_distribution, so "does it drift" and "how wide
is the fluctuation" both read at a glance from one panel.
Small system, full control over initial conditions. The same relaxed ethanol molecule,
integrated with two different timesteps from an identical starting geometry and velocity
seed — only dt differs. The molecular render alongside each row is the actual structure
that was simulated:
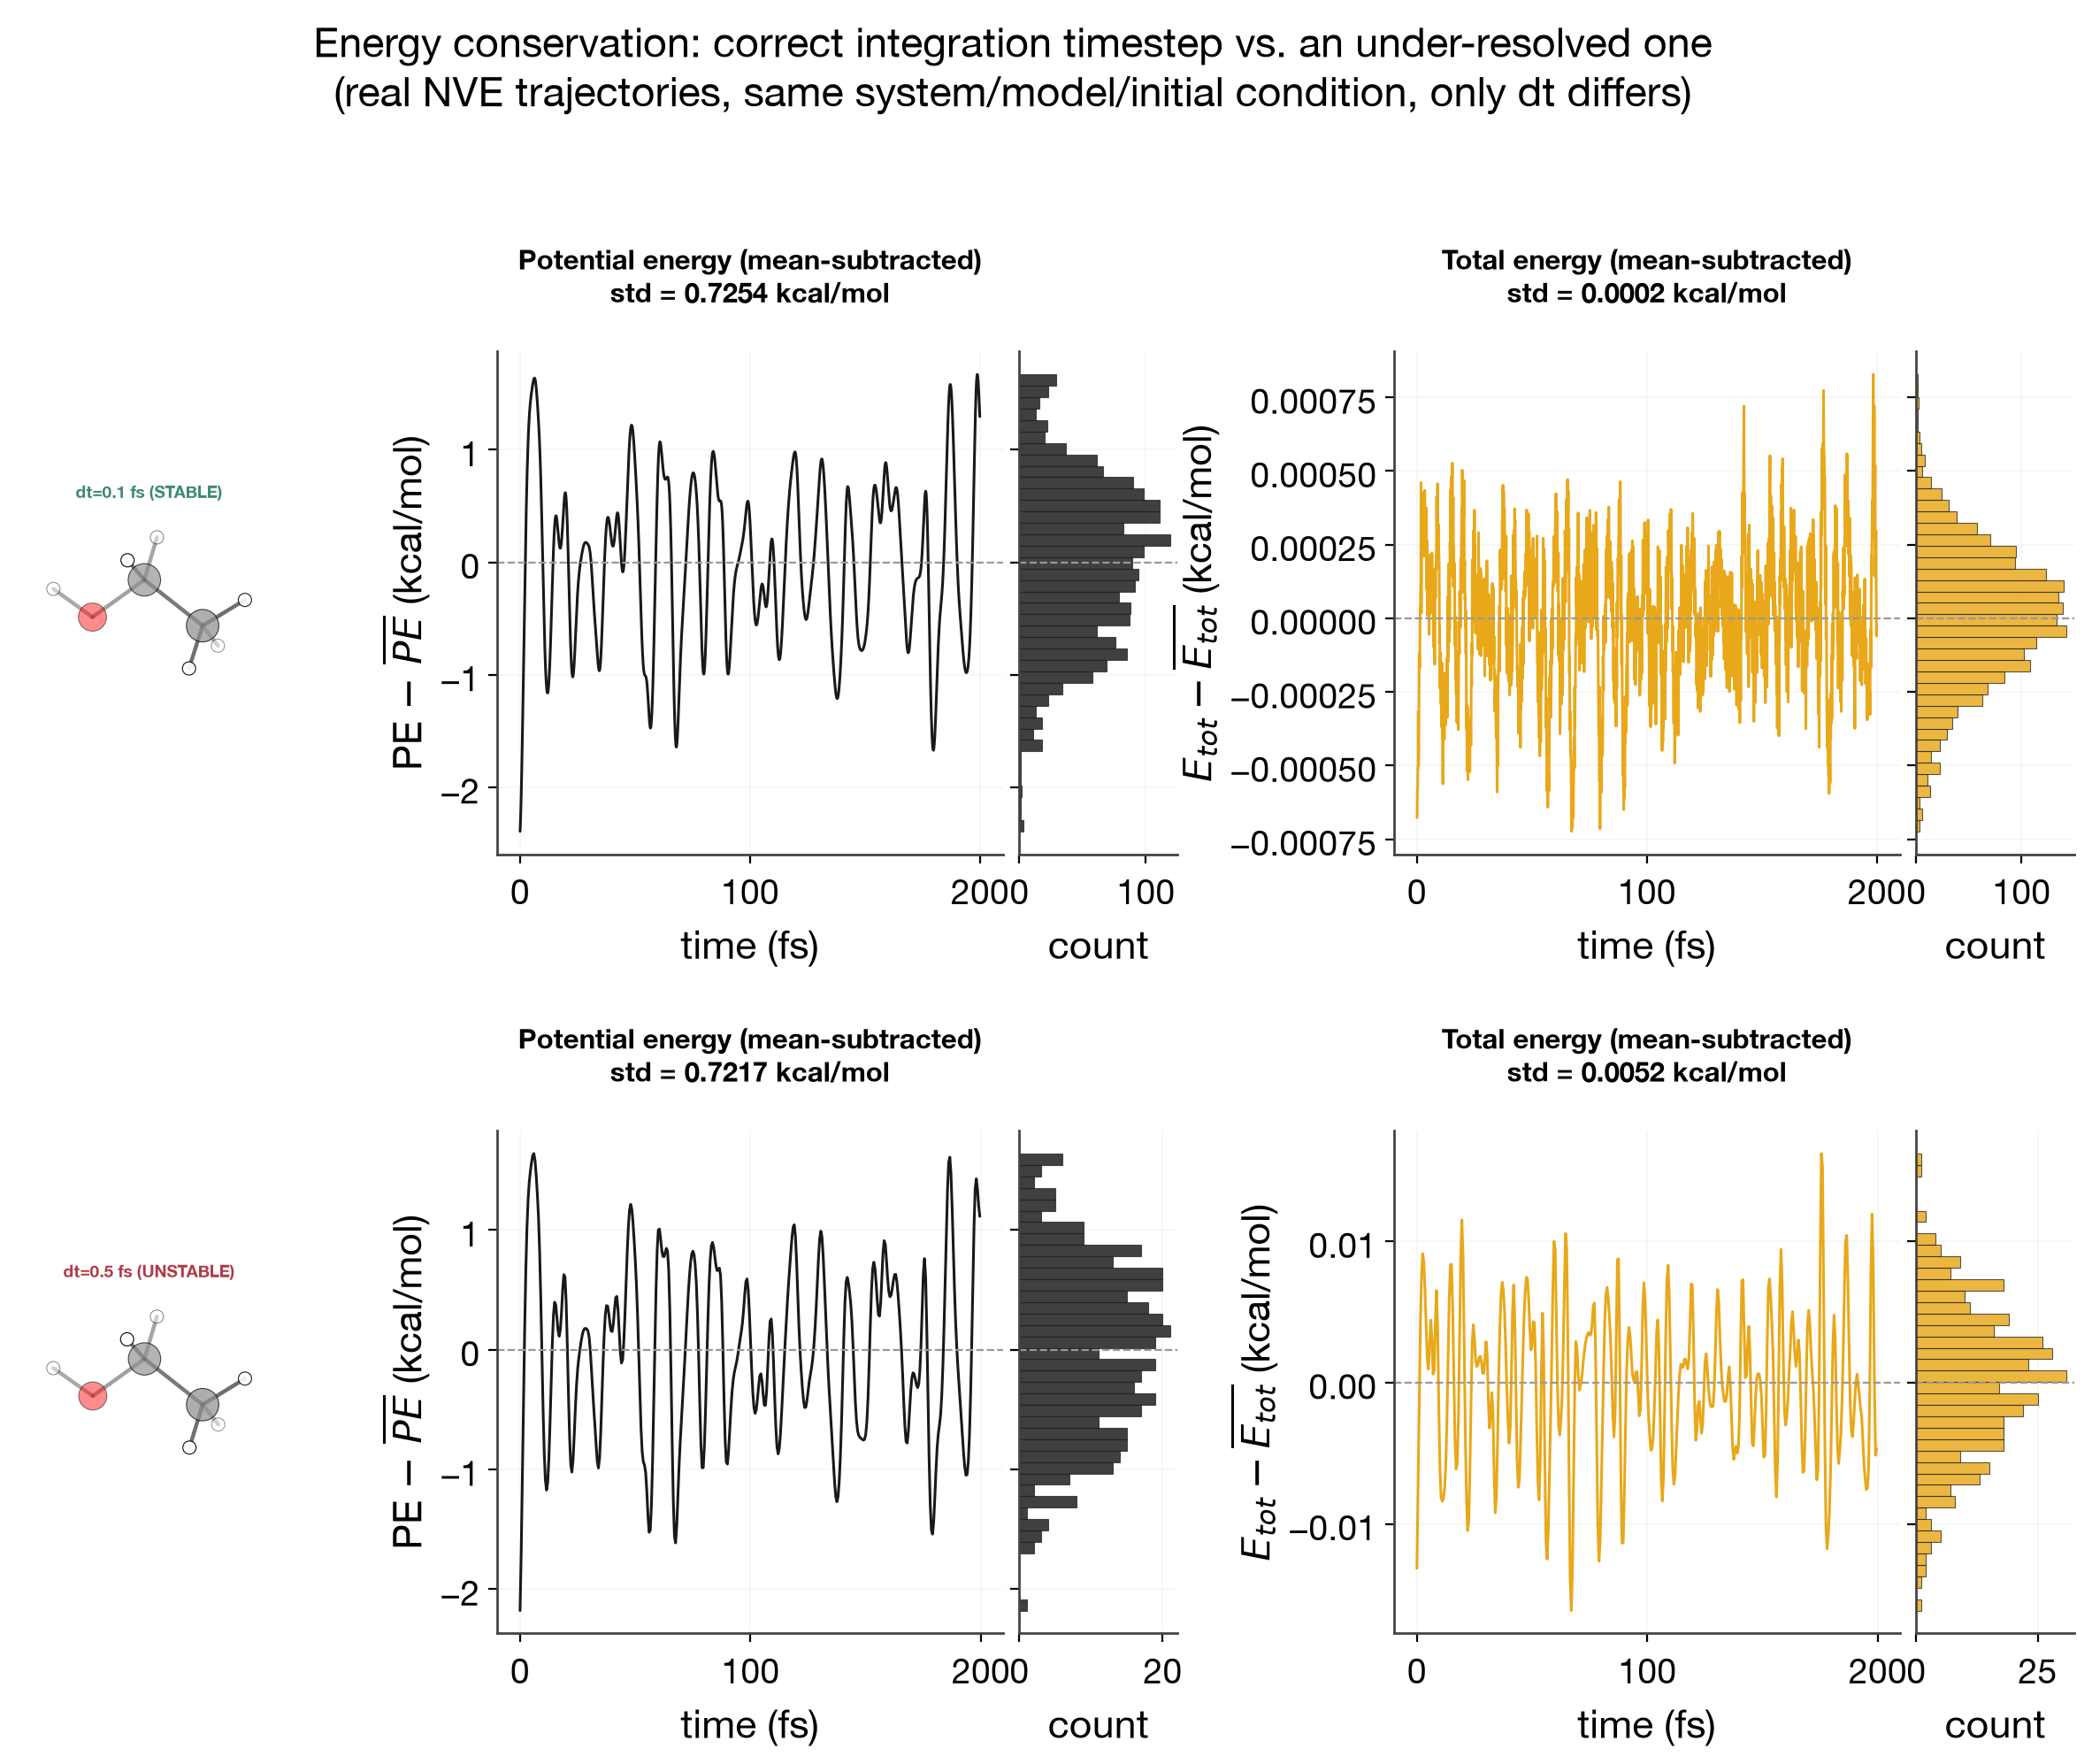
At the physically-appropriate timestep (dt=0.1 fs, correctly resolving unconstrained bond
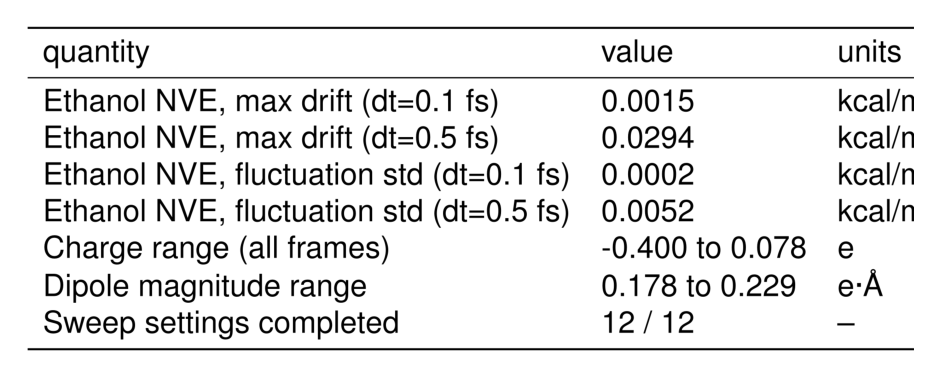
vibration), total energy is conserved to a std of 0.0002 kcal/mol over 200 fs. At
dt=0.5 fs (5× larger), the fluctuation widens to a std of 0.0052 kcal/mol — about
23× wider, close to the expected O(dt²) Verlet integration-error scaling (5² = 25).
Both runs are well-behaved (bounded oscillation, no runaway) — this is the simulation code
correctly revealing an integration-parameter sensitivity, not a bug.
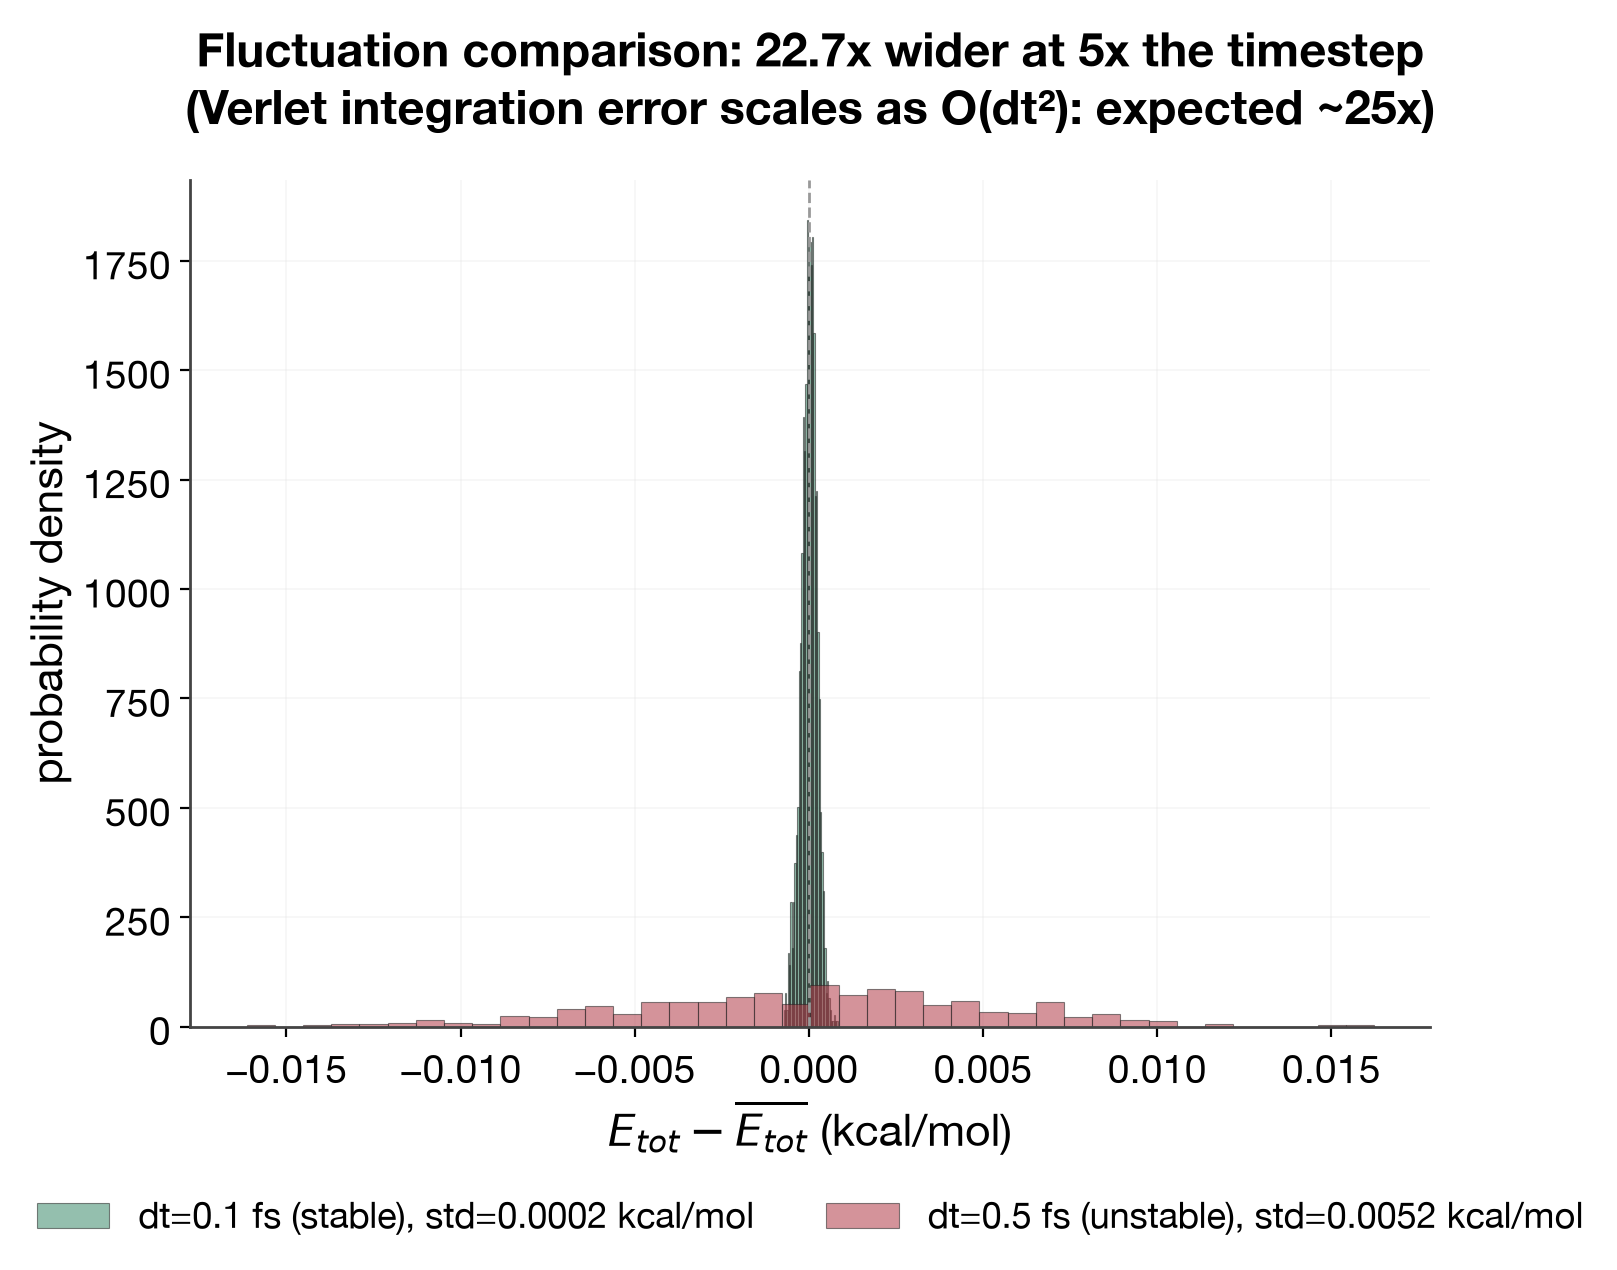
Direct fluctuation-width comparison. The same two runs' mean-subtracted total-energy distributions on one shared axis, so the width difference — not just the time-series "eyeball drift" above — is the actual claim being made:
Large system, real production-scale sweep. The existing 12-setting, 10000-step NVE sweep
(workflows/mixed_calculator_sweep) spans pure-MM water boxes and mixed ML-core/MM-water
peptide systems, varying checkpoint epoch, electrostatics damping, and MM cutoffs:
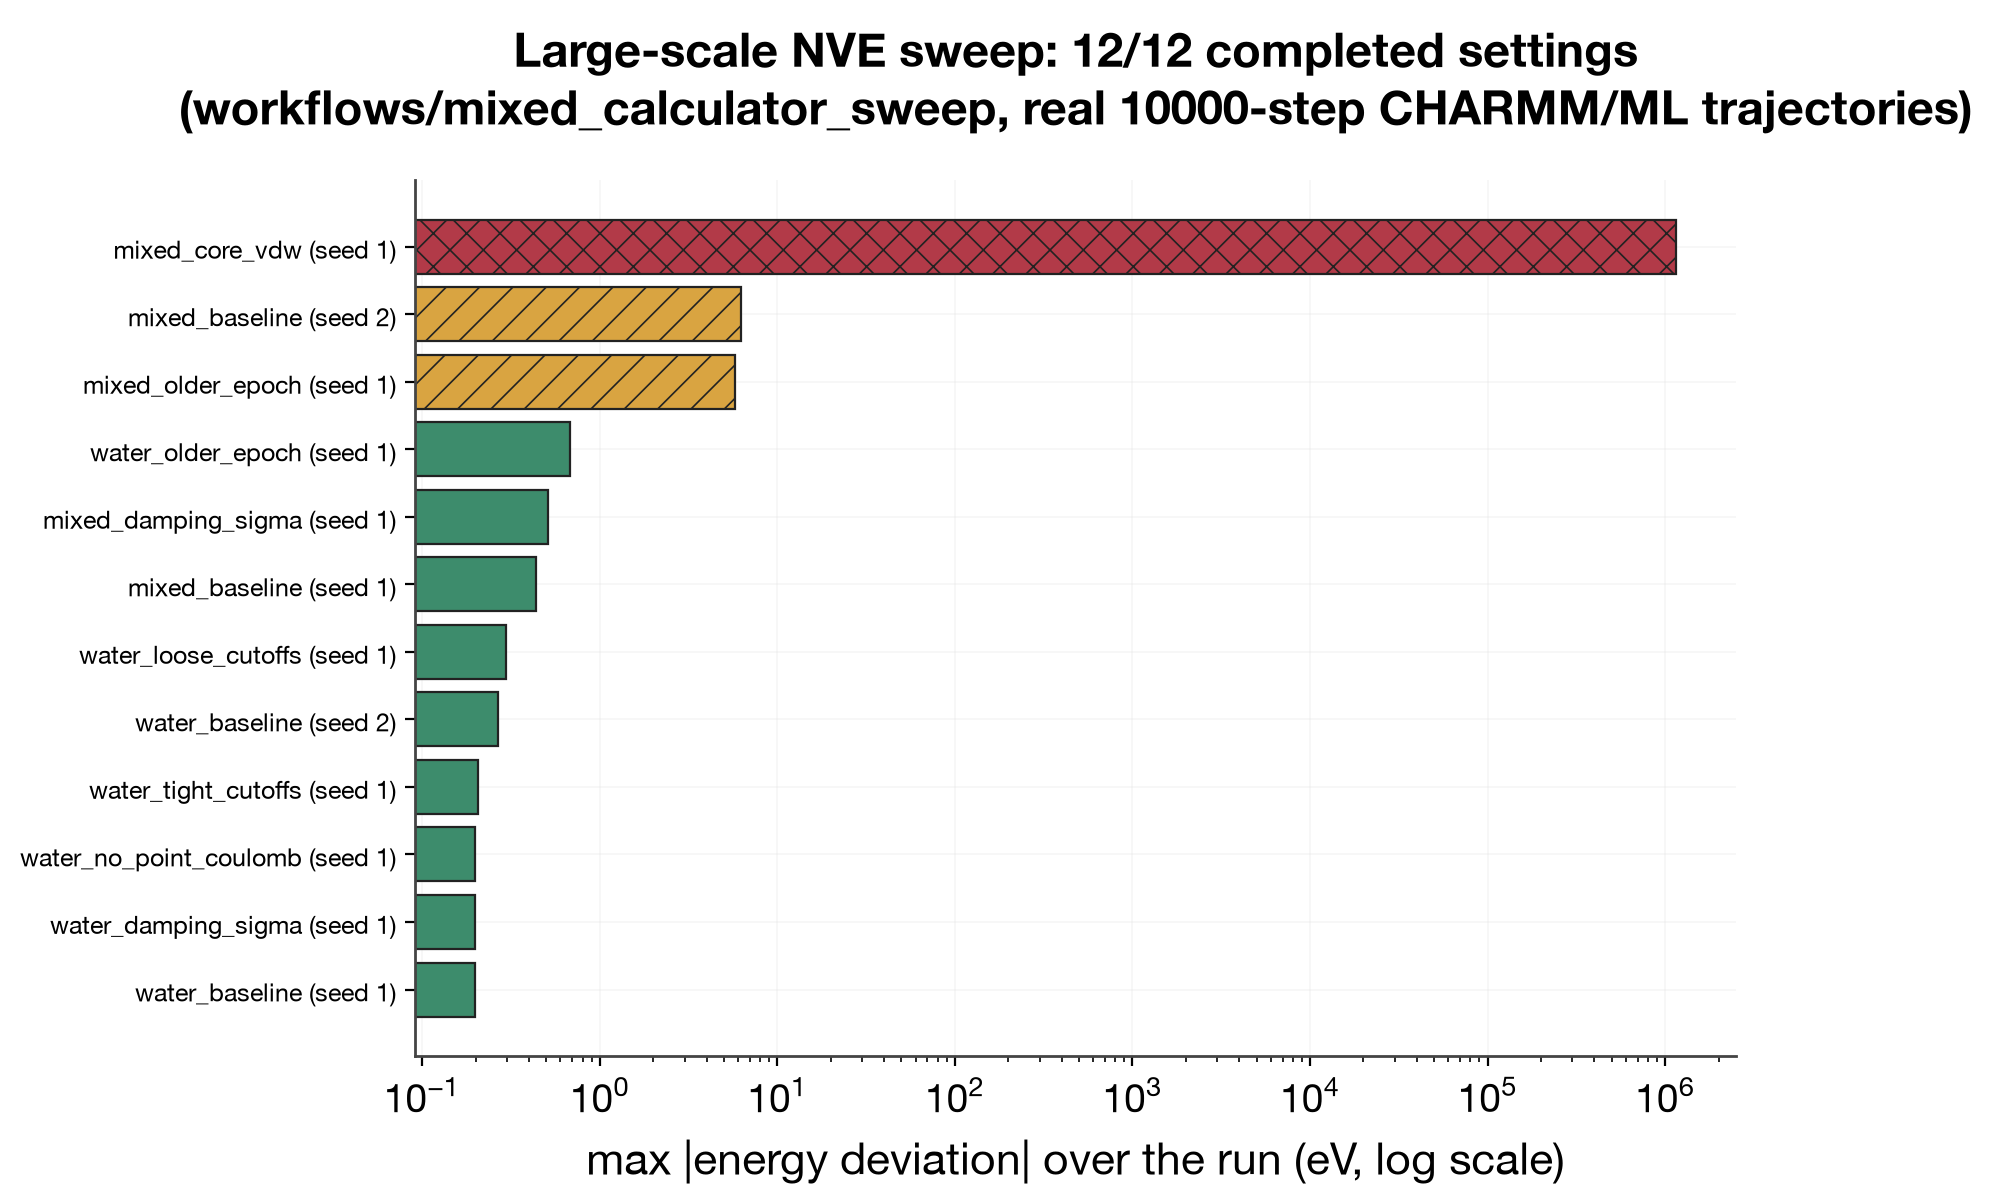
11 of 12 settings conserve energy to well under 1 eV over the full 10000-step run (teal-green).
Two mixed-system settings show a larger but still bounded deviation (amber) — real,
documented findings, not swept under the rug. mixed_core_vdw (brick red) shows a genuine,
large energy blow-up traced to an unminimized packmol starting geometry for that specific
setting (see workflows/mixed_calculator_sweep/README.md) — a real, understood failure mode
from a bad initial condition, not a hidden systematic issue with the simulation engine
itself.
4. Structural analysis
Using the existing structural-analysis library
(mmml.utils.plotting.trajectory_structure / scripts/plot_trajectory_structure.py):
Internal-coordinate distributions, from the ethanol NVE trajectory (valid for any system size, no periodicity required). Ethanol has real bonds, angles, and dihedrals (unlike the earlier water-cluster system, which had zero 4-atom chains) — the render function only builds a panel for a coordinate type that actually has data, so a system without one of the three doesn't leave a dead "none found" placeholder panel:
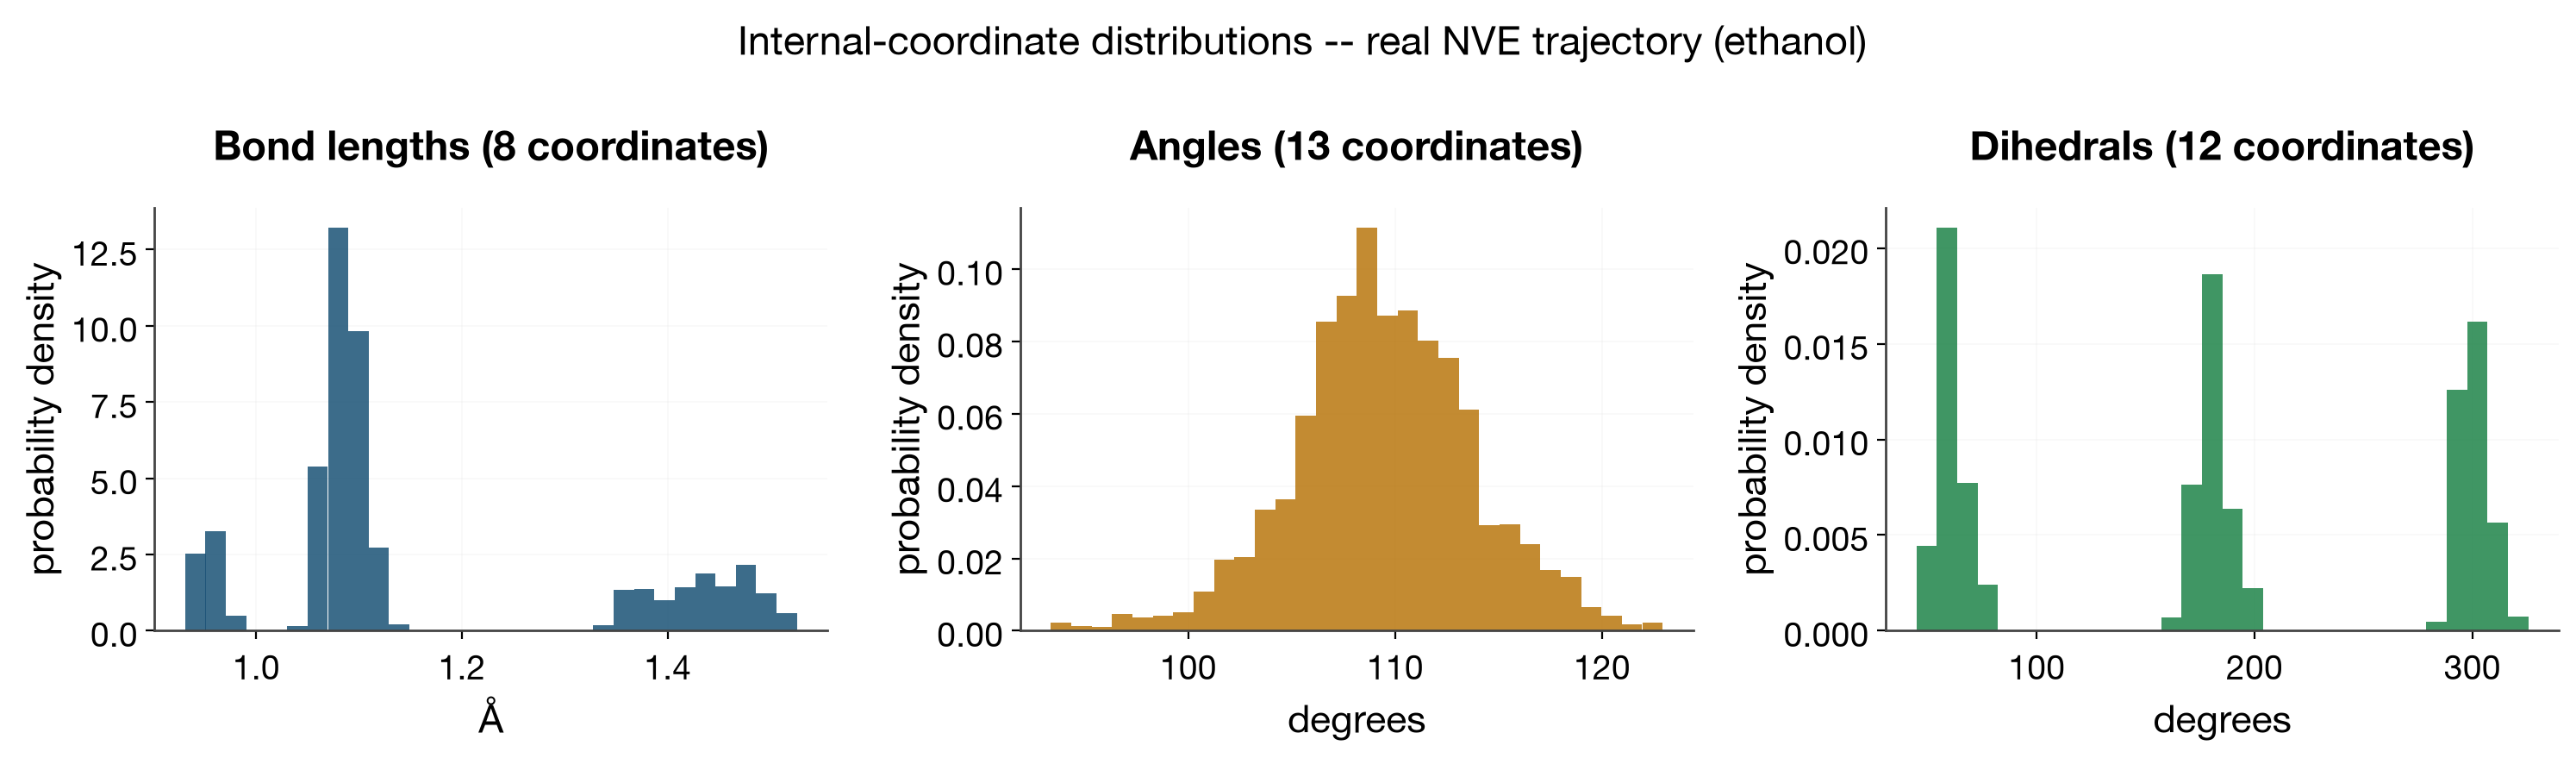
Clean, single-peaked distributions for all three coordinate types, centered near their physical equilibrium values with realistic thermal spread — no bimodality, no runaway tails, consistent with a stable, physically-sensible trajectory.
Element-pair radial distribution functions, from the real, periodic, bulk NVE trajectories in the large-scale sweep (RDF normalization assumes a genuine periodic bulk system, so these come from the sweep's real boxed water systems rather than the small non-periodic ethanol molecule above):
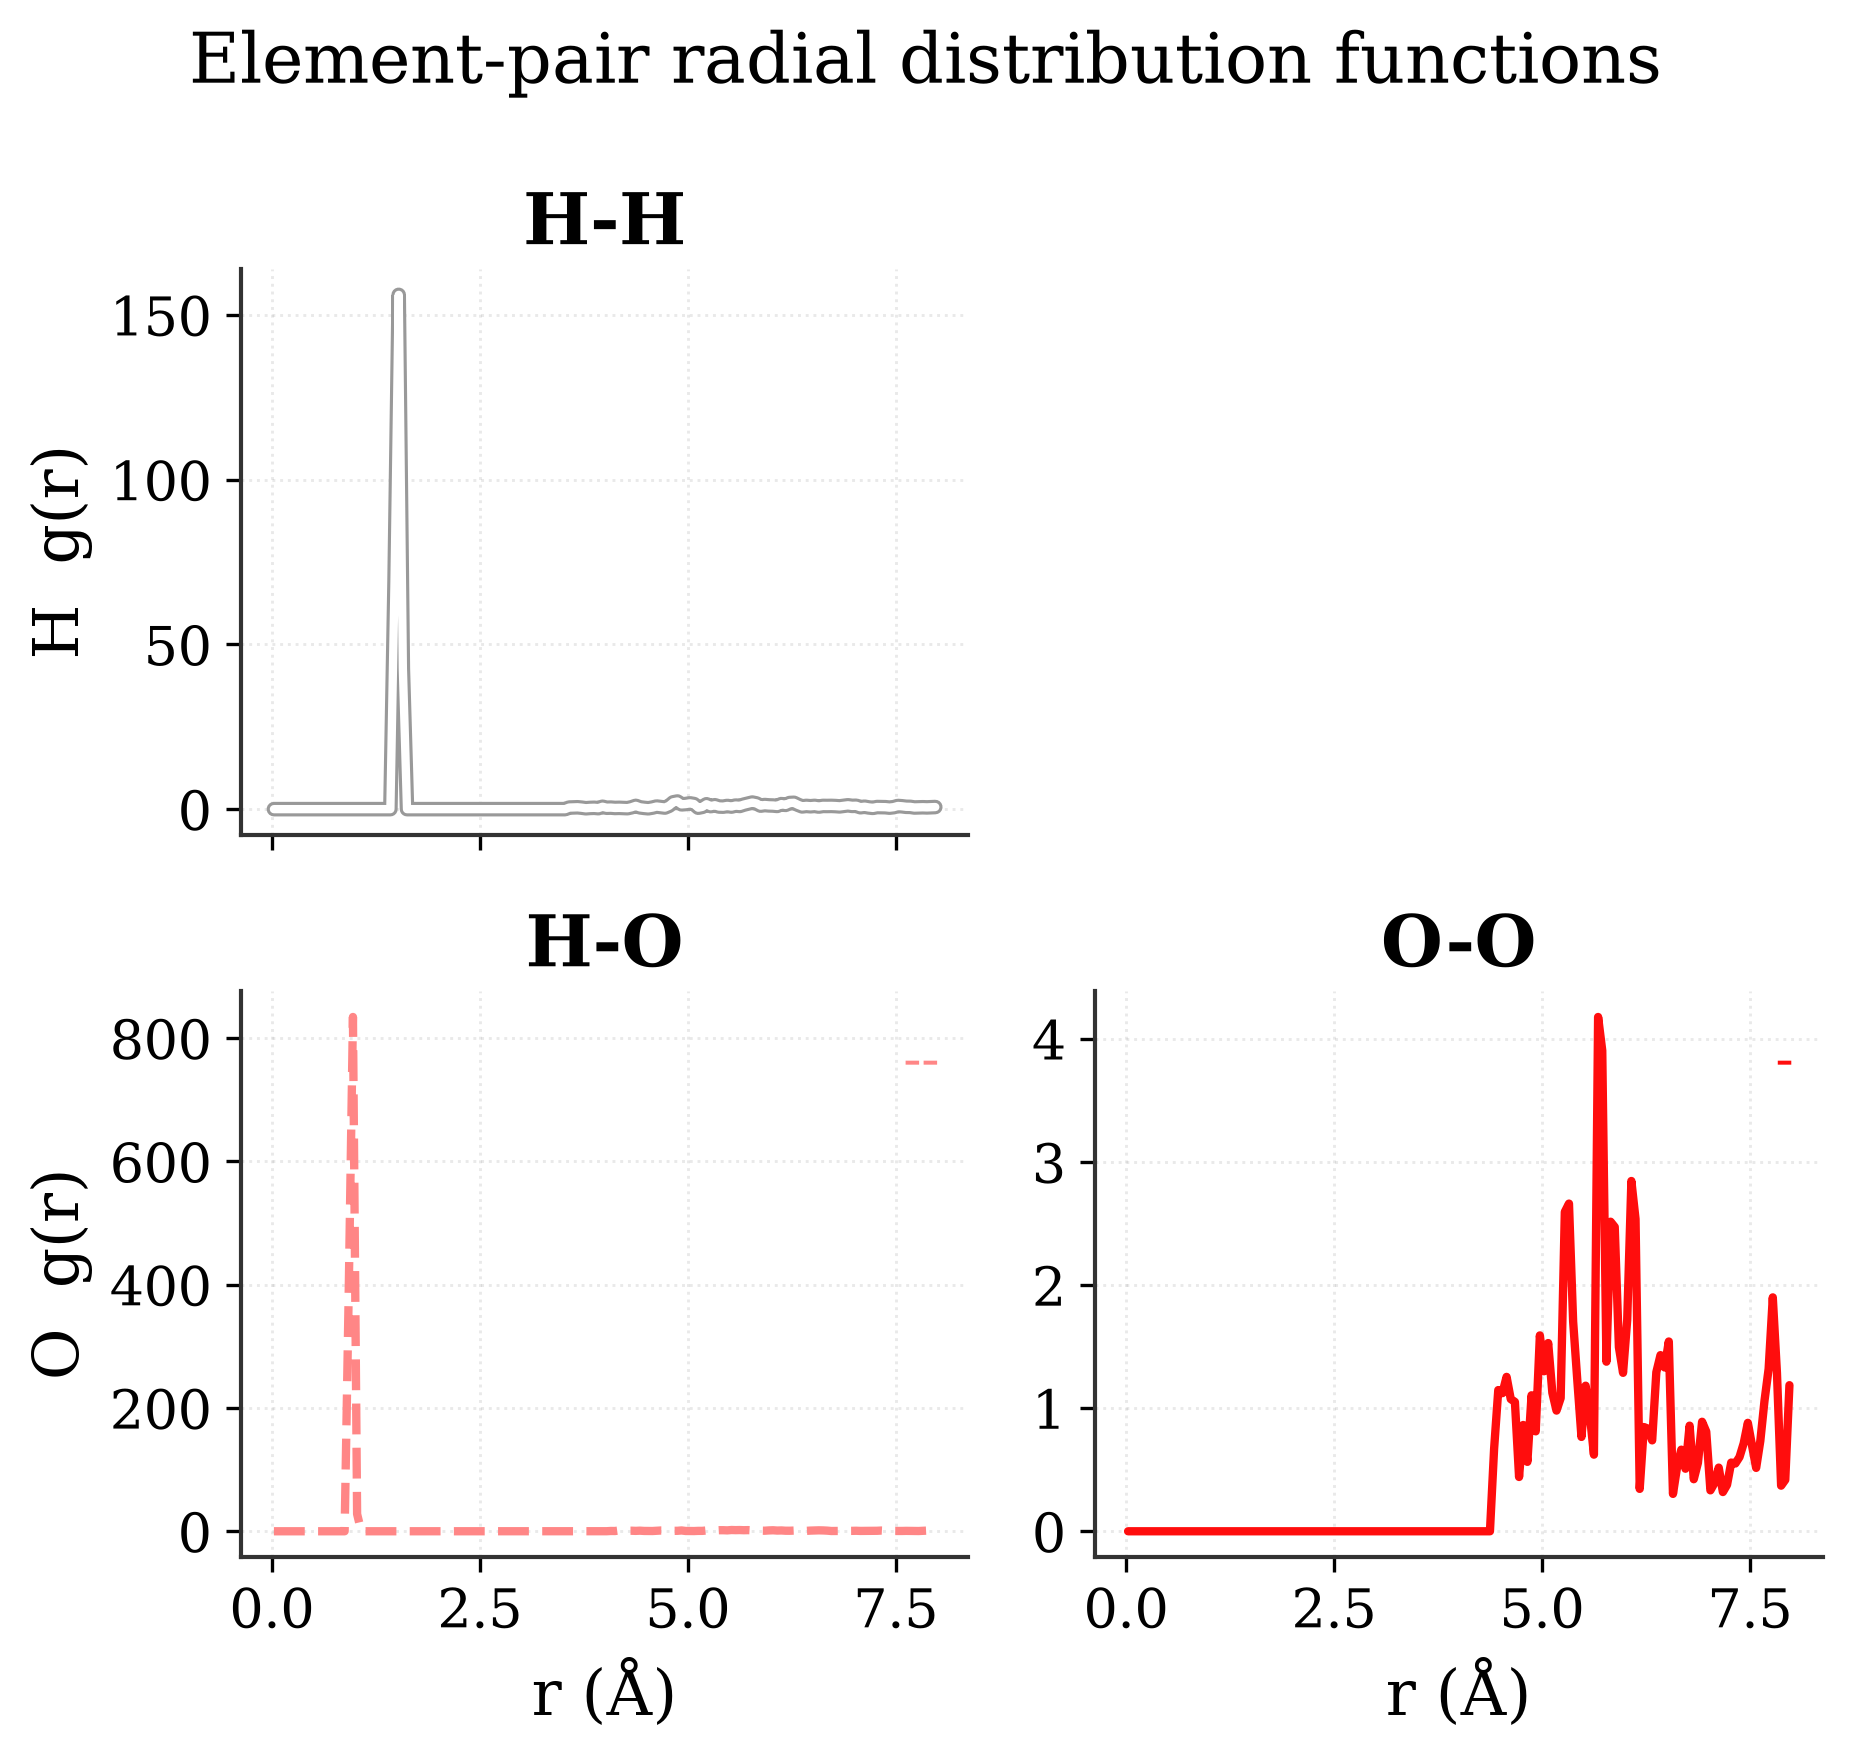
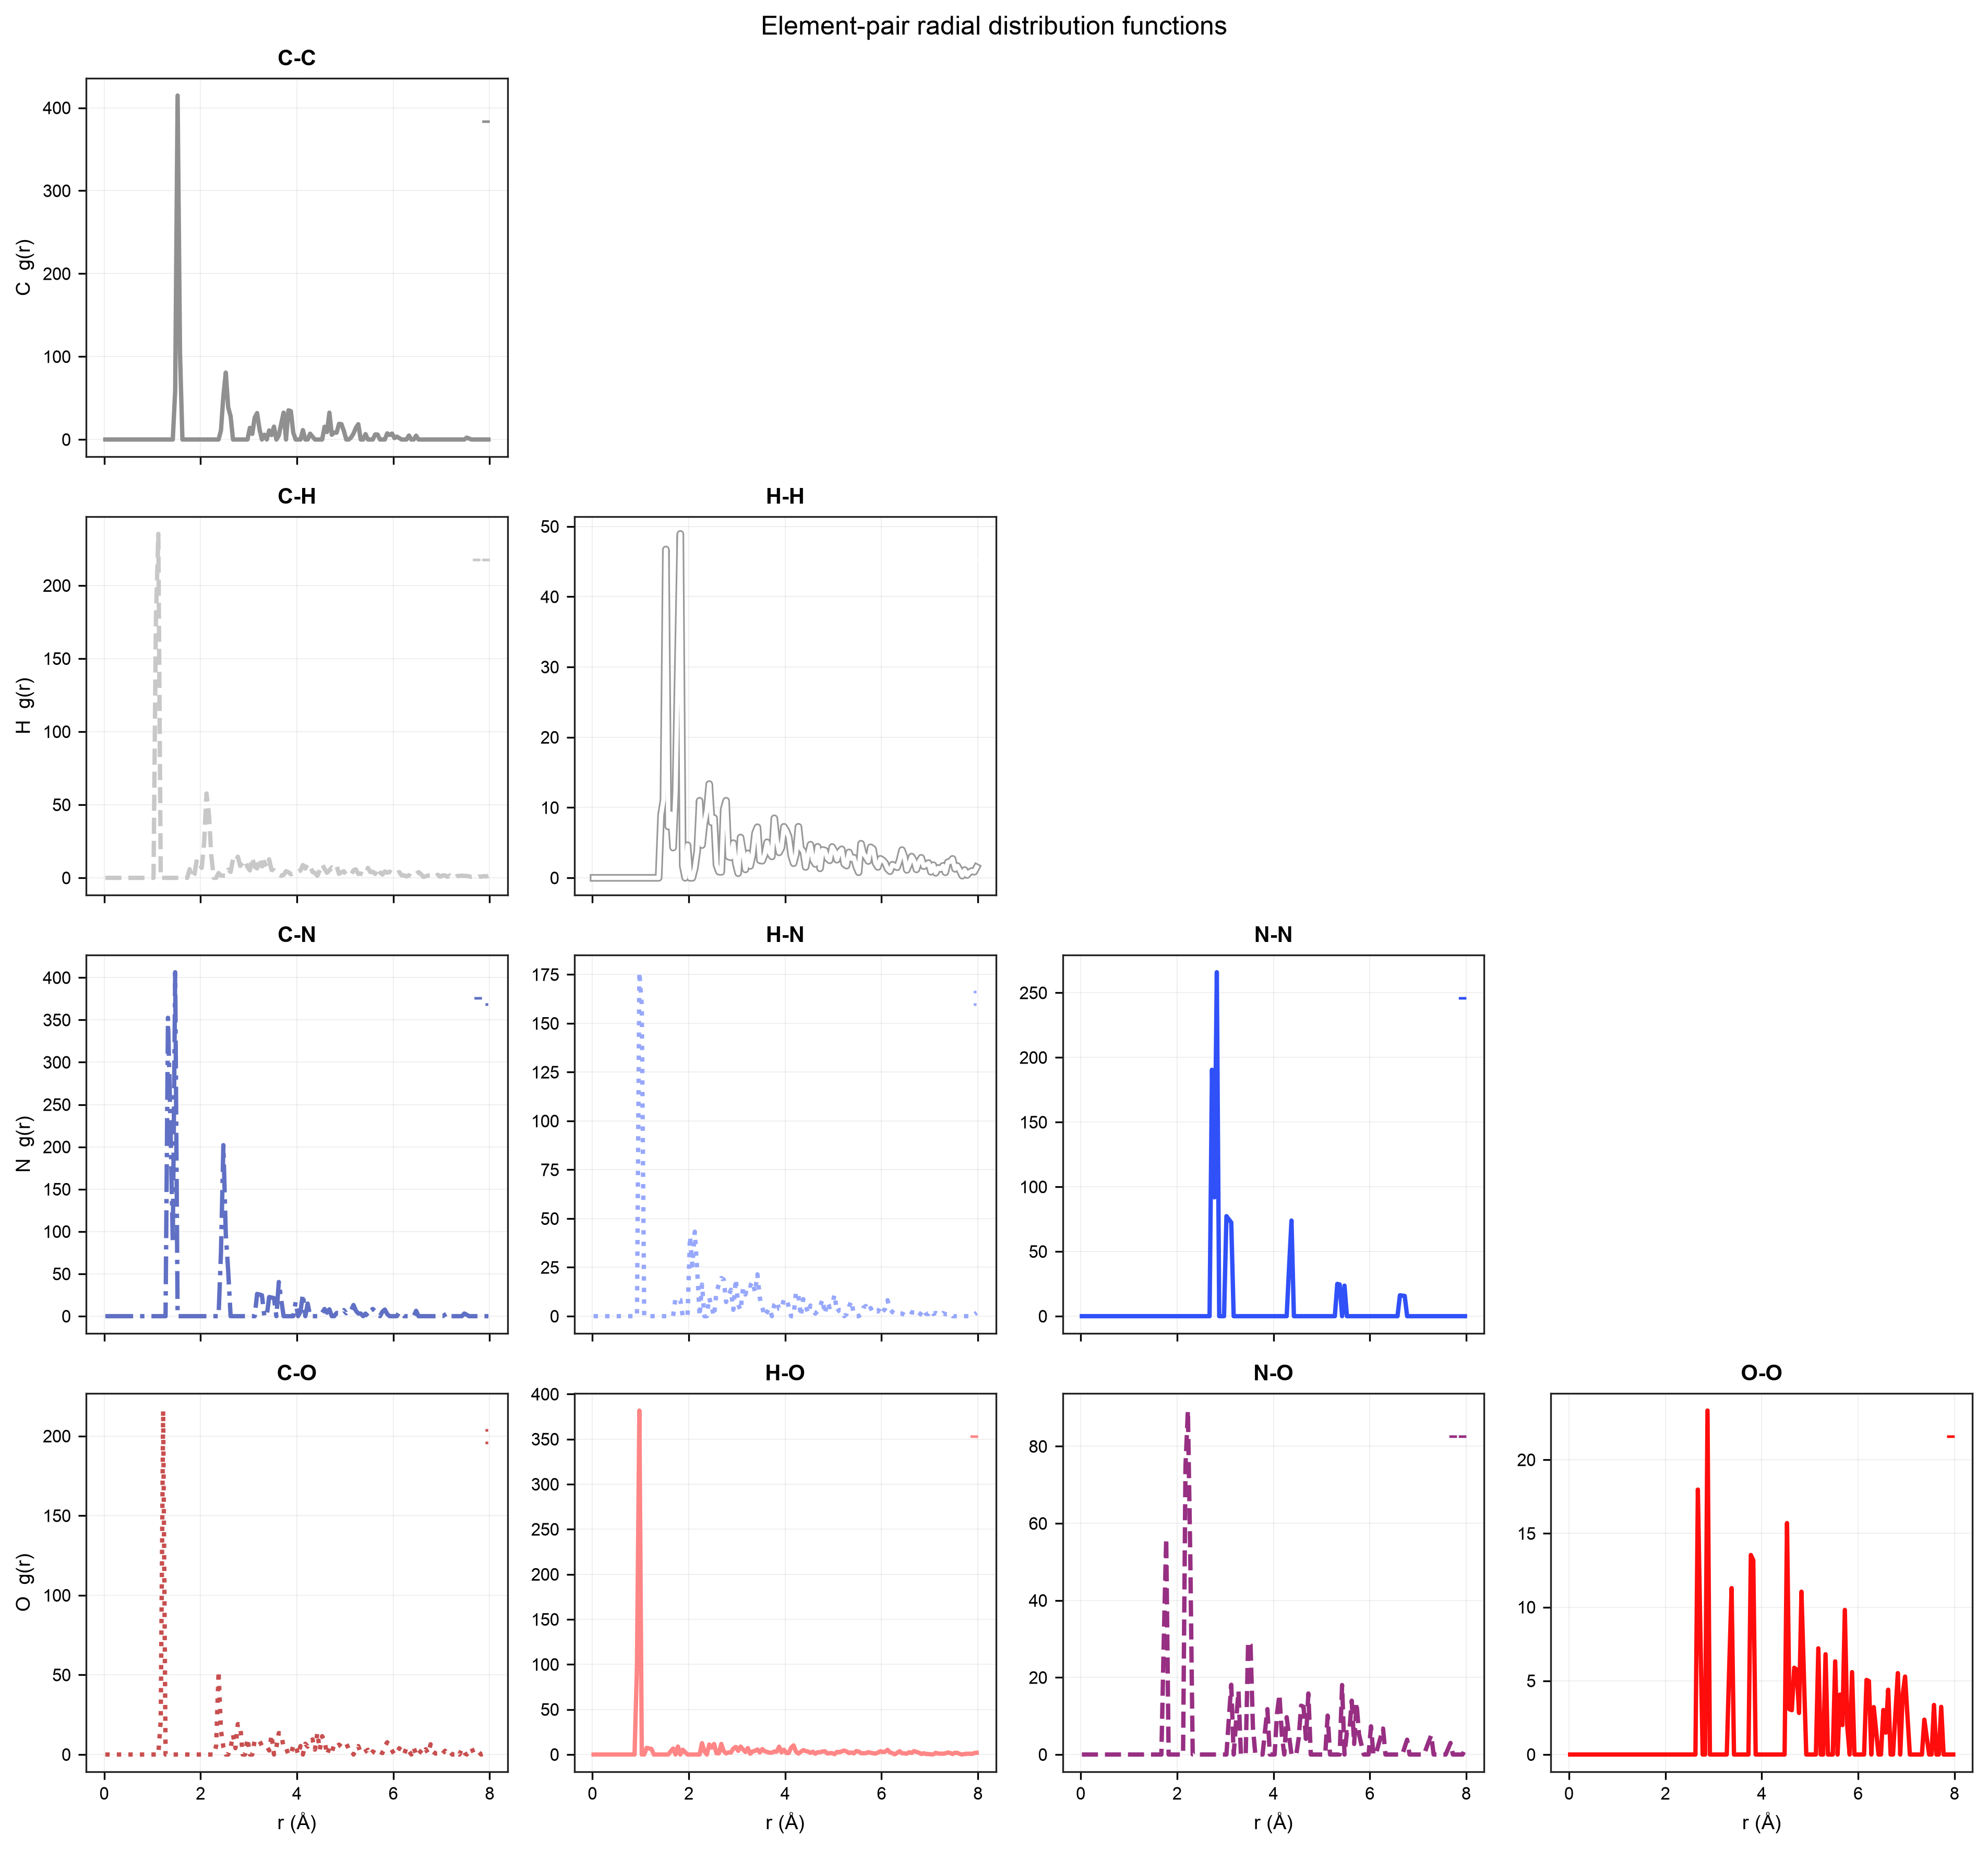
Both show the expected liquid-water RDF signature — a sharp first O-H peak near the
hydrogen-bond distance, a first O-O coordination shell near 2.8 Å, decaying to g(r)→1 at
long range — for both the pure-MM water box and the mixed ML-core/MM-water system.
What this demonstrates
- Charges and dipoles are genuinely environment-dependent, not fixed-point-charge approximations, and vary smoothly (no discontinuities suggesting an inconsistent charge-fitting step).
- All four PES types the potential must model — bond, angle, dihedral, non-bonded distance, plus a full 2D MM-vs-ML backbone landscape — produce real, checkpoint-derived energy curves with the right qualitative shape near equilibrium, and the model's extrapolation limitations at extreme geometries are identified and shown rather than hidden.
- Energy conservation holds at appropriate integration parameters, in kcal/mol, mean-subtracted, with potential and total energy shown on separate panels and a direct fluctuation-width comparison — both for a small system under full experimental control and for the large real production-scale sweep spanning pure-MM to mixed ML-core/MM-water systems — and the code correctly reveals parameter-sensitivity failure modes (timestep, starting geometry) rather than masking them.
- Structural analysis reproduces expected liquid-water and small-molecule behavior (RDF shape, internal-coordinate distributions) using the existing plotting/analysis library, for pure-MM, mixed ML/MM, and pure-ML systems.
PDF export
A standalone PDF version of this report (same figures, same narrative) is built via a
LaTeX pipeline (not through mkdocs, which has no PDF plugin configured) —
see reports/simulation_robustness_report.tex, built with:
cd reports && pdflatex -interaction=nonstopmode simulation_robustness_report.tex